


Transmission Connection Point Forecasts for Victoria
Purpose
AEMO has prepared this page to provide information about its transmission connection point forecasts for Victoria.
AEMO publishes these connection point forecasts in line with clause 5.22.18(b) of the National Electricity Rules, as part of its national transmission planner (NTP) functions.
Disclaimer
AEMO has made every reasonable effort to ensure the quality of the information in this publication but cannot guarantee that information, forecasts and assumptions are accurate, complete or appropriate for your circumstances. This publication does not include all of the information that an investor, participant or potential participant in the National Electricity Market might require, and does not amount to a recommendation of any investment.
Anyone proposing to use the information in this publication (including information and reports from third parties) should independently verify and check its accuracy, completeness and suitability for purpose, and obtain independent and specific advice from appropriate experts.
Accordingly, to the maximum extent permitted by law, AEMO and its officers, employees and consultants involved in the preparation of this publication:
- make no representation or warranty, express or implied, as to the currency, accuracy, reliability or completeness of the information in this publication; and
- are not liable (whether by reason of negligence or otherwise) for any statements, opinions, information or other matters contained in or derived from this document, or any omissions from it, or in respect of a person’s use of the information in this publication.
Published: December 2020
Please note: these forecasts are based on information available to AEMO as at 1 November 2020, although AEMO has endeavoured to incorporate more recent information where practical.
This page uses many terms that have meanings defined in the National Electricity Rules (NER). The NER meanings are adopted unless otherwise specified. The 2020 AEMO Connection Point Forecasting Methodology overview provides a summary of the modelling approach undertaken, a detailed methodology document will be published in Q1 2021.
Acknowledgement
AEMO acknowledges, in alphabetical order, AusNet Services, Citipower, Essential Energy, Jemena, Powercor and United Energy, for their support, co-operation, and contribution in providing data and information used in these forecasts.
Background
The connection point forecasting methodology directly incorporates the effects on demand due to population growth and embedded technologies such as photovoltaics, batteries and electric vehicles. Forecasts of maximum and minimum demand are produced for connection points independently, and the resulting forecasts are described as "non-coincident". Forecasts of connection point demand are also produced for times of regional maximum and minimum demand, and these are described as "coincident" forecasts. The "coincident" forecasts are reconciled to regional forecasts from AEMO’s 2020 Electricity Statement of Opportunities.
The 2020 Projections for Small-scale Embedded Technologies Report produced by the CSIRO describes numerous inputs applied in the 2020 Connection Point Forecasts. Population projections included in the forecast inputs were sourced from the Australian Bureau of Statistics.
2020 connection point results and insights
Refer to the dynamic interface for detailed information on individual connection points. In the following figures and tables, some directly connected industrial loads are excluded due to confidentiality.
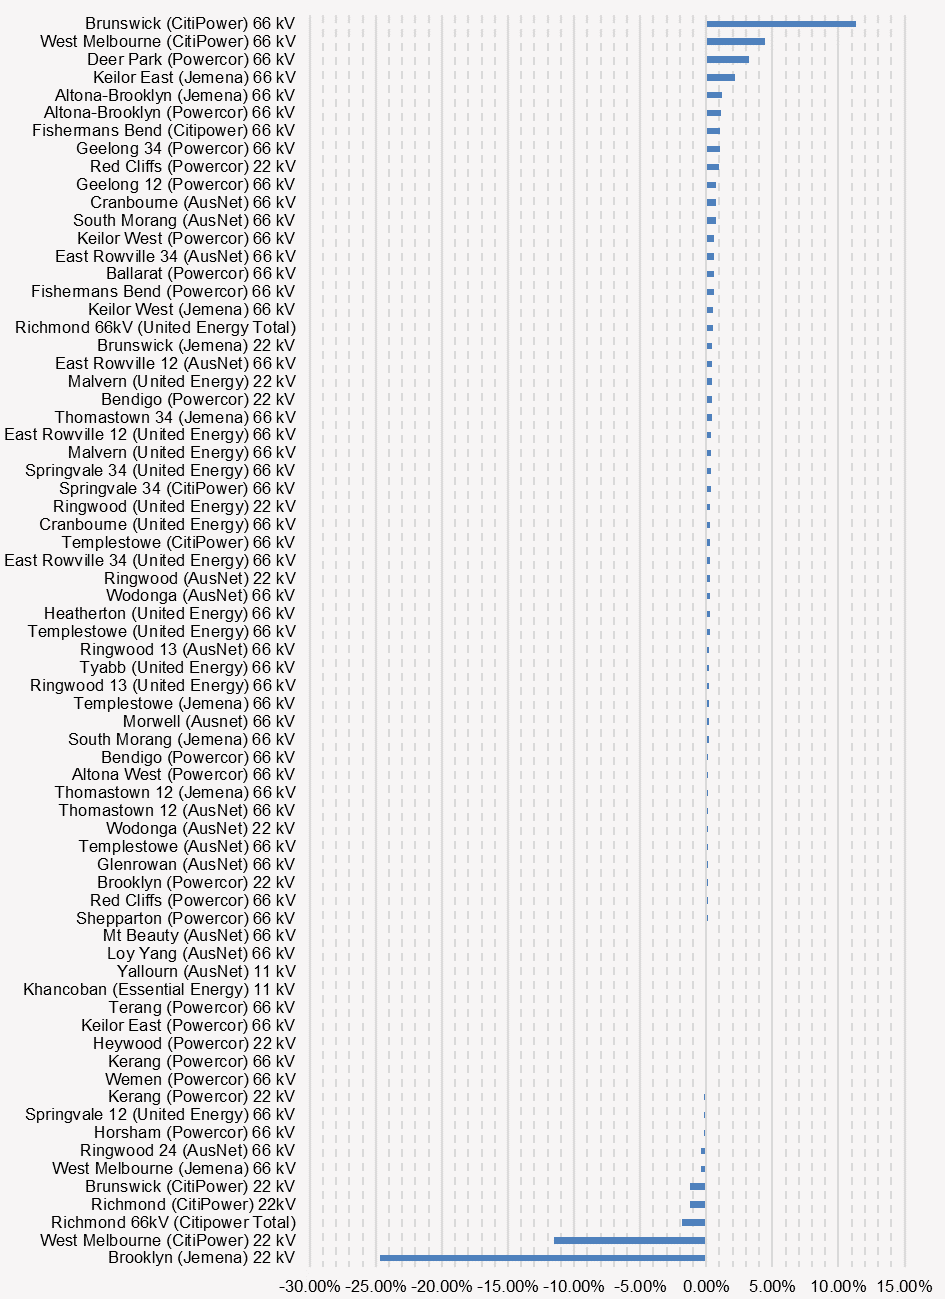
Figures 1 and 2 show the average annual growth in maximum operational demand for summer and winter over the 10-year forecasting period in Victoria. Growth is shown as a percentage of the latest actual maximum operational demand, after adjusting for outages and temporary load transfers.
Figure 1: Forecast average annual growth in maximum operational demand for summer (10% POE) as percentage of actual maximum operational demand in 2019-20
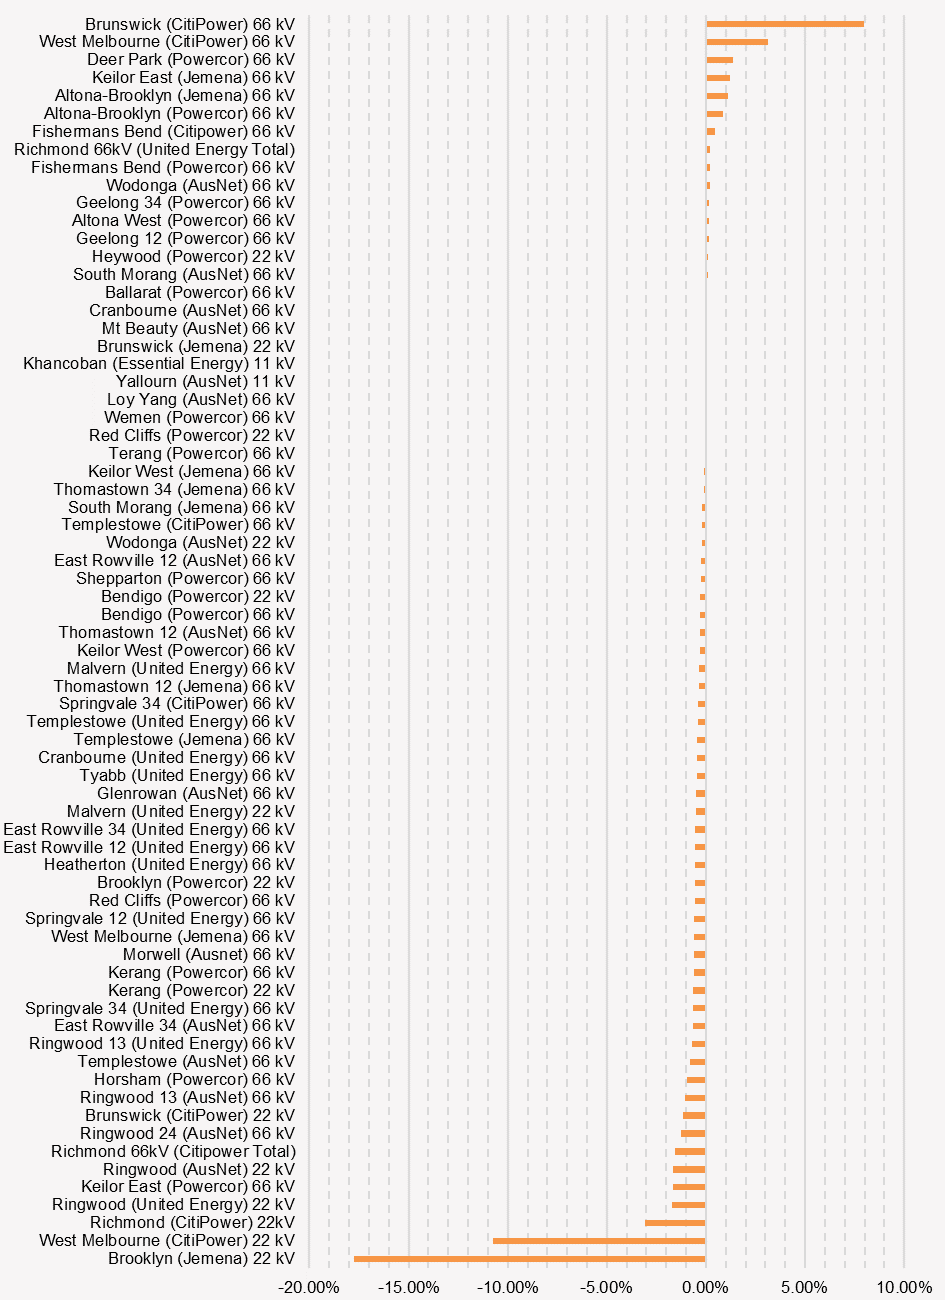
Figure 2: Forecast average annual growth in maximum operational demand for winter (10% POE) as percentage of actual maximum operational demand in 2019-20
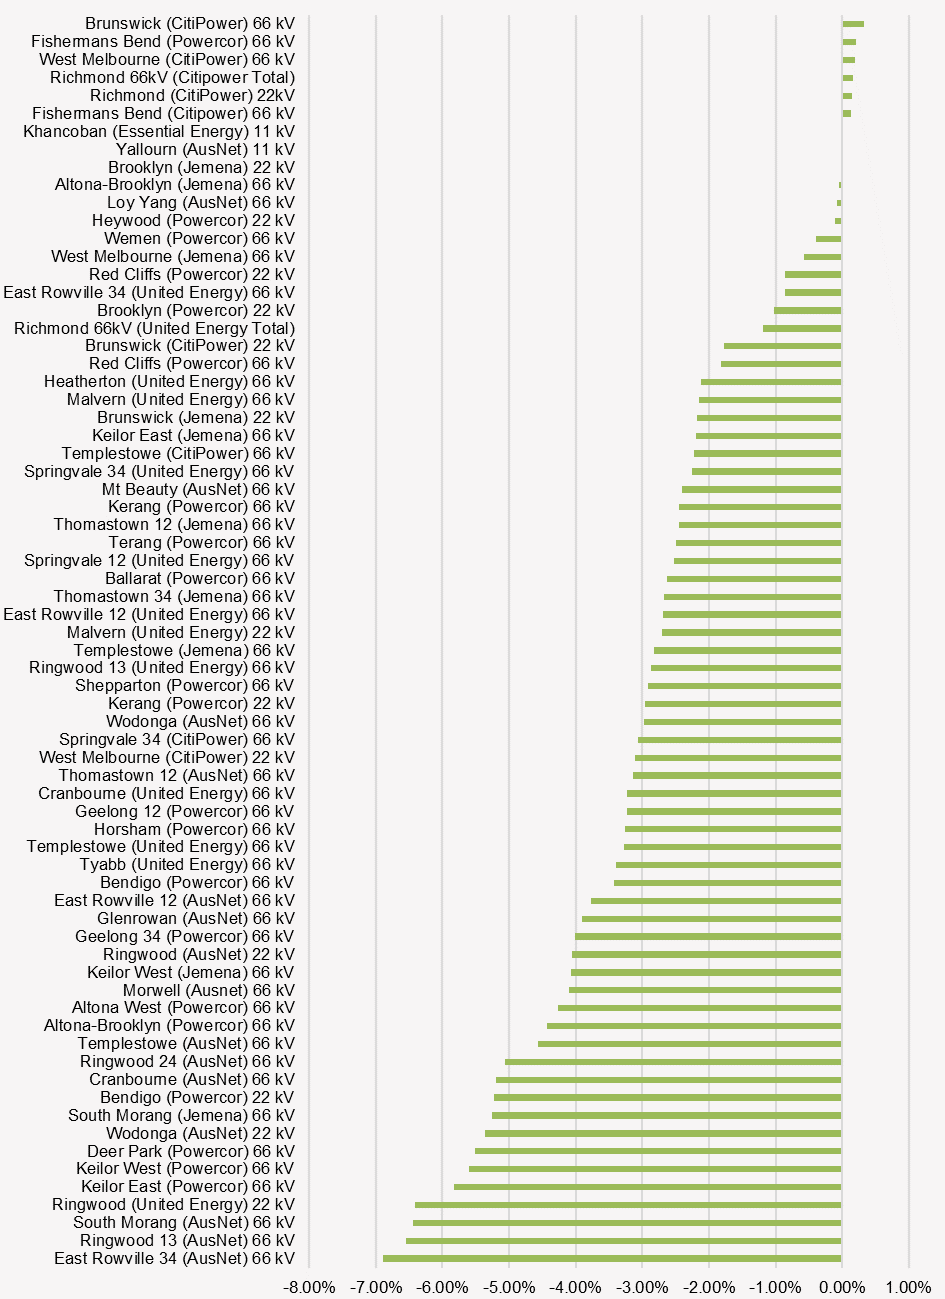
Figures 3 and 4 show the average annual growth in minimum operational demand for summer and shoulder seasons. Growth is shown on the same basis as figures 1 and 2, as a percentage of the latest actual maximum operational demand, after adjusting for outages and temporary load transfers. Once again, some loads are excluded from the figures to maintain confidentiality.
Figure 3: Forecast average annual growth in minimum operational demand for summer (90% POE) as percentage of actual maximum operational demand in 2019-20
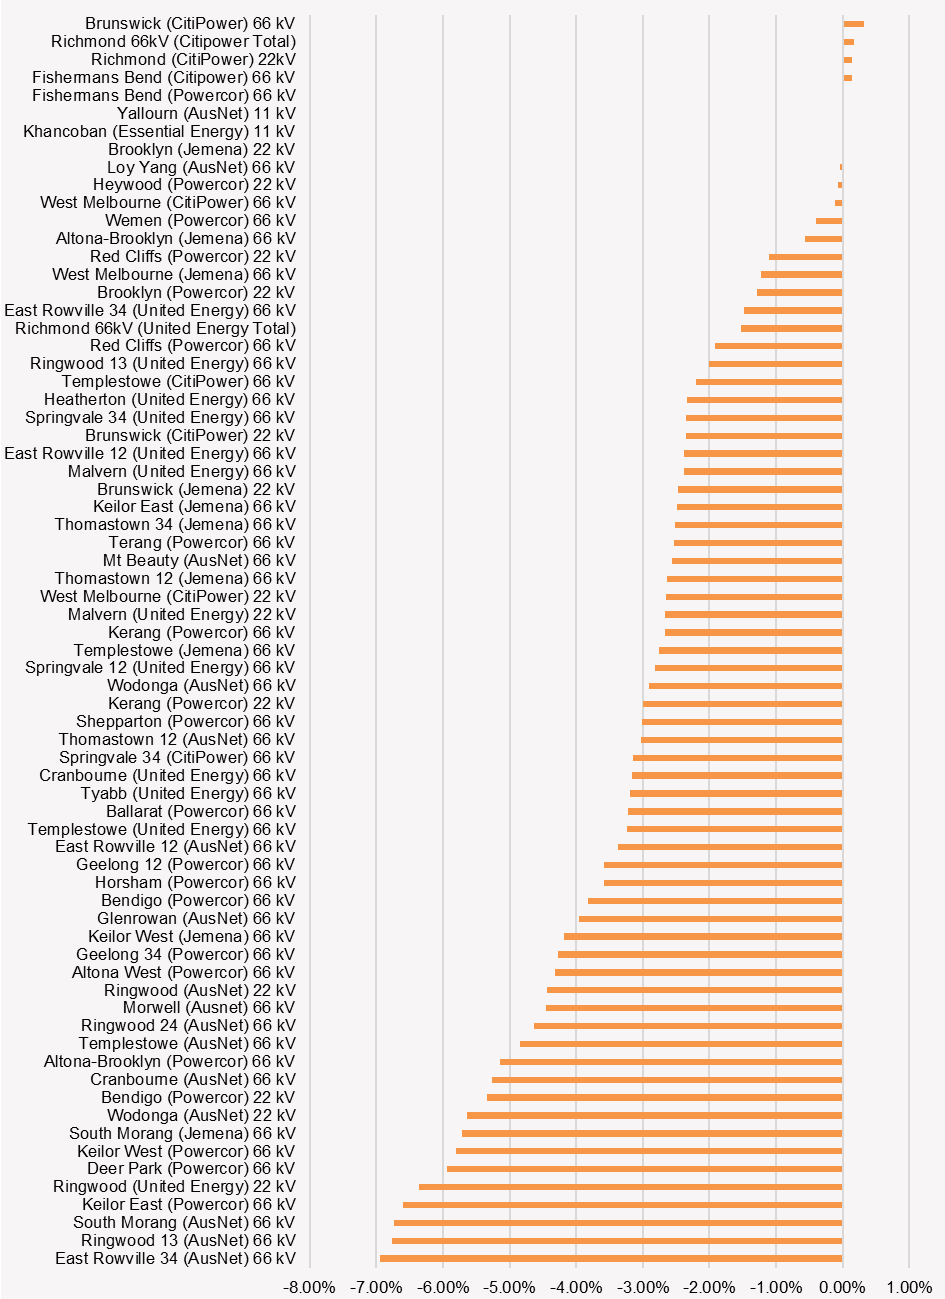
Figure 4: Forecast average annual growth in minimum operational demand for shoulder season (90% POE) as percentage of actual maximum operational demand in 2019-20
Tables 1 and 2 list the drivers of large changes in operational demand over the 10-year forecast period. Changes are considered large if the average annual growth rate exceeds 2% of the actual maximum operational demand in 2019-20.
Table 1: Drivers at connection points with average annual change in maximum operational demand (10% POE) exceeding 2% of actual maximum operational demand in 2019-20
|
Season |
Forecast maximum demand increase greater than threshold |
Forecast maximum demand decrease greater than threshold |
|
Summer |
Brunswick (CitiPower) 66 kV, West Melbourne (CitiPower) 66 kV: Load transfers and new residential, commercial and industrial loads impact demand. Some of these are related to decommissioning of West Melbourne (CitiPower) 22 kV connection point.
|
Brooklyn (Jemena) 22 kV: Large temporary commercial and industrial loads will impact demand. Richmond (CitiPower) 22kV: Load transfers and large temporary commercial and industrial loads will impact demand. West Melbourne (CitiPower) 22 kV: Decommissioned by 2025. |
|
Winter |
Brunswick (CitiPower) 66 kV, West Melbourne (CitiPower) 66 kV: Load transfers and new residential, commercial and industrial loads impact demand. Some of the load transfers are related to decommissioning of West Melbourne (CitiPower) 22 kV connection point.
Deer Park (Powercor) 66 kV: Load transfers and new residential, commercial and industrial loads impact demand.
Keilor East (Jemena) 66kV: Significant increase in demand from some large commercial loads. |
Brooklyn (Jemena) 22 kV: Large temporary commercial and industrial loads will impact demand. West Melbourne (CitiPower) 22 kV: Decommissioned by 2025. |
Table 2: Drivers at connection points with average annual change in minimum operational demand (90% POE) exceeding 2% of actual maximum operational demand in 2019-20
|
Season |
Forecast minimum demand increase greater than threshold |
Forecast minimum demand decrease greater than threshold |
|
Summer |
No connection points exceed threshold |
52 of 70 connection points exceed threshold: Significant increases in PV capacity over 10 years as projected by CSIRO, incentivised by the Victorian Government's Solar Homes Program. |
|
Shoulder |
No connection points exceed threshold |
51 of 70 connection points exceed threshold: Significant increases in PV capacity over 10 years as projected by CSIRO, incentivised by the Victorian Government's Solar Homes Program. |
Supplementary information
|
An Excel workbook with the following information for each transmission connection point:
|
|
|
Separate spreadsheet for reactive power forecasts at each transmission connection point, providing complementary information for power system studies. Values are provided for reactive power at connection point maximum demand. AEMO plans to extend the methodology to forecast reactive power at connection point minimum demand. |
|
|
Transmission Connection Point Forecasting Methodology Overview 2020 |
The current AEMO transmission connection point forecasting methodology outlines the process through which the forecasts were developed. |
Archive of Previous Victoria Forecasts and Reports
2019
- 2019 Dynamic interface for connection points in Victoria
- 2019 Reactive power forecasts for connection points in Victoria
2018
- 2018 Dynamic interface for connection points in Victoria
- 2018 Reactive power forecasts for connection points in Victoria
2017
- 2017 Dynamic interface for connection points in Victoria
- 2017 Reactive power forecasts for connection points in Victoria
2016
- 2016 Transmission Connection Point Forecasting Methodology
- 2016: Transmission Connection Point Forecasting Report for Victoria – forecasts developed by AEMO
- 2016 Dynamic interface for connection points in Victoria
- 2016 Reactive power forecasts for connection points in Victoria
2015
- 2015: Transmission Connection Point Forecasting Report for Victoria – forecasts developed by AEMO
- 2015 Dynamic interface for connection points in Victoria
- 2015 Reactive power forecasts for connection points in Victoria
- High Level Review of Transmission Connection Point Forecast for Victoria – Final Report of Independent Peer Reviewer
2014
- 2014: Transmission Connection Point Forecasting Report for Victoria – forecasts developed by AEMO
- 2014 Dynamic interface for connection points in Victoria
- 2014 Reactive power forecasts for connection points in Victoria
- High Level Review of Transmission Connection Point Forecast for Victoria – Final Report of Independent Peer Reviewer