


Last Sunday there was a new record for minimum grid demand set in South Australia. We know what you’re thinking - what on earth does that mean?
The demand for electricity is typically driven by the weather, varying by time of year and time of day. In Australia, maximum demand on the electricity grid currently occurs during the summer months in the afternoon when it’s hottest. It’s driven by ‘cooling load’ which is the amount of energy space used by cooling to maintain the temperature level (for comfort indoors) of your thermostat.
The lowest demands on the electricity grid typically appear overnight when appliances are switched off and air-conditioners aren’t running. Lower demand occurs during what’s referred to as the shoulder season - the time of year when it’s neither excessively hot or cold (effectively autumn and spring).
As the penetration of rooftop solar PV (photovoltaic) grows, it is generating so much electricity during the middle of the day that it’s lowering the demand required by the electricity grid to record levels. The penetration in South Australia is now so high that the state recorded its lowest ever grid demand last Sunday.
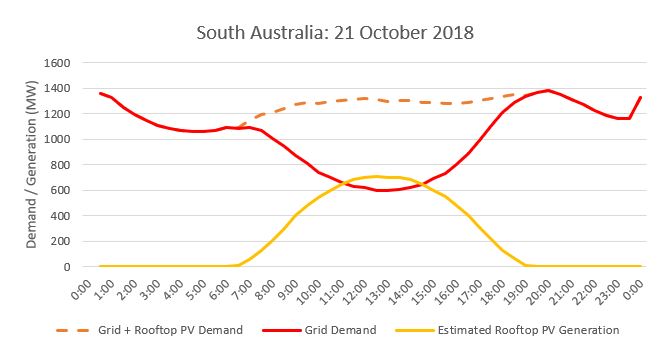
Electricity demand is lowest when weather conditions are within human comfort levels (i.e. low 20s). But on clear, sunny, mid-20s days, solar generation can be at its highest levels. This results in record low grid demand occurring in the middle of the day and this is becoming more and more frequent on mild, sunny weekends and public holidays in South Australia. Other states like Western Australia, Victoria and Queensland aren’t too far behind, where rooftop PV penetration is also high and growing rapidly.
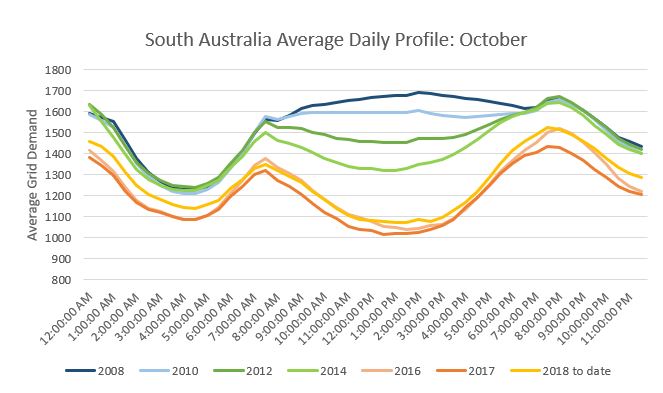
Increased electricity generation from rooftop PV is also shifting maximum grid demand from mid-afternoon when it is warmest, and demand is generally highest, to later in the evening by an hour or two, edging ever closer to sunset. What we’re seeing is the traditional models of daytime/night-time as peak/off-peak for grid demand no longer correlating, as lowest demand is not always occurring overnight. Below is how South Australia’s grid demand has changed over the last ten years in October, a low demand month.
Increased electricity generation from rooftop PV is also shifting maximum grid demand from mid-afternoon when it is warmest, and demand is generally highest, to later in the evening by an hour or two, edging ever closer to sunset. What we’re seeing is the traditional models of daytime/night-time as peak/off-peak for grid demand no longer correlating, as lowest demand is not always occurring overnight. Below is how South Australia’s grid demand has changed over the last ten years in October, a low demand month.
“People are putting thousands of megawatts of solar PV on their roofs, which is dropping demand during in the middle of the day in what historically was the peak period. This is called the duck curve, as a duck’s belly curves downwards, and South Australia, with its high penetration of solar PV, now has a world leading duck curve in relation to minimum demand,” said Mike Davidson, AEMO’s Manager of Operational Forecasting.
As a result of so much rooftop PV generation, quick swings or ramps in the demand required from the grid are becoming bigger and more common. For example, if a large cloud front that blocks the sun moves over a city, demand can go from low to high within minutes. There is now also a significant ramp up in demand in the evenings when the sun sets, reaching a maximum as people return home from work and school. All of these factors are creating a challenge for AEMO’s forecasters, as they work to forecast how much grid demand there will be each day so that the Control Room can bring sufficient flexible generation on line to support the demand.
As penetration of rooftop solar PV continues to increase in every state in Australia, we’ll be working hard to ensure that the grid is operated safely and reliably. To that end, AEMO is collaborating closely with energy market participants, industry partners, stakeholders and consumers to ensure that solar power is an important element in Australia’s future electricity generation fleet.
For example, we are engaging with governments, energy companies and new service providers to work out how existing appliances, such as hot water heaters and pool pumps, together with new smart technologies such as electric vehicles and batteries, can be used to absorb or store electricity from solar generation to help manage the swings and variation that large penetrations of solar roof-top generation can bring.
For more in-depth analysis from the energy industry, as well as videos, animations and podcasts, sign up to our fortnightly Energy Live newsletter (bottom of the homepage).