


2018 Electricity Forecasting Insights – March 2018 Update
Overview
This Electricity Forecasting Insights Update provides independent electricity consumption, maximum and minimum demand forecasts for each National Electricity Market (NEM) region over a 20-year forecast period (2017-18 to 2036-37).
-
Consumption met by grid-supplied electricity is forecast to remain relatively flat for the next 20 years, despite projected 30% growth in population and projected growth in the Australian economy. Towards the end of the period, consumption is forecast to increase, driven by a fast ramp up of electric vehicle sales.
-
Business demand is forecast to remain flat, while net residential demand is projected to decline as growth in population and appliance usage is offset by increased generation from rooftop photovoltaic (PV) and by energy efficiency initiatives. Main growth is from the uptake of electric vehicles, with 19% of the light vehicle fleet forecast to be electric by 2036-37.
-
Under a stronger economic growth forecast, consumption is projected to be 16% higher by 2036-37 than in the Neutral scenario, while weaker economic growth could result in forecast consumption 28% lower than the Neutral scenario at that time.
-
Maximum demand is forecast to remain flat until the mid-2020s, and then to start to increase as the time of maximum demand moves later in the day when rooftop PV output is small or zero.
This forecast updates the electricity forecast for the NEM published in August 2017 as part of the 2017 NEM Electricity Statement of Opportunities (ESOO). The 2017 ESOO forecast provided an update to the 2017 Electricity Forecasting Insights forecast published in June 2017.
These latest forecasts reflect changes to assumptions about:
-
Electricity consumption by Queensland’s coal seam gas sector
-
Electric vehicle forecasts
-
Price outlook and impact on industrial changes, particularly in Victoria
-
Auxiliary load.
This Update also includes an updated estimate of current Demand Side Participation (DSP) in the NEM reflecting new data and revised methodology. This replaces the 2017 DSP estimate.
Forecast definitions
All references to consumption and demand on these pages refer to operational consumption/demand (sent out). This is the consumption to be supplied to the grid by scheduled, semi-scheduled, and significant non-scheduled generators (excluding their auxiliary loads, or electricity used by the generator). See this page for further information about the operational demand definition.
AEMO’s forecasts explore a range of scenarios that represent a probable range of futures for Australia across Weak, Neutral, and Strong economic and consumer outlooks. The key scenario differences are summarised in the table below.
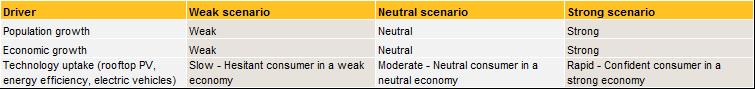
Further information about AEMO’s 2017 scenarios can be found here.
Further information
Summary forecasts
Assumption changes
Demand Side Participation